Statistics Dashboard Design for Distributors
Published on Dribbble / ui | Tetiana Diakova
Hey guys!
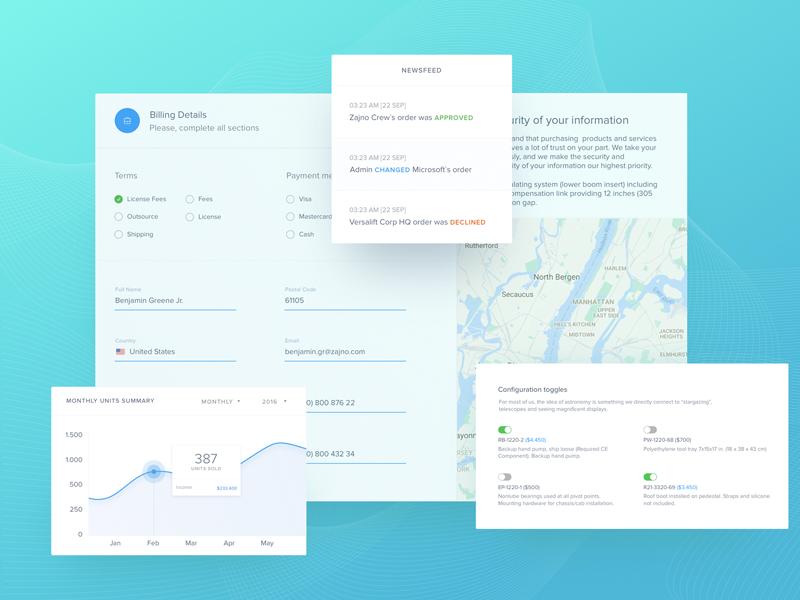
We’ve been designing a cool 2-way management system for heavy machinery producers and distributors, a designated app for each party. It’s aimed to facilitate the cooperation between the companies, providing each party with instant access to all necessary stats.
Today we’re sharing the billing details screen along with some key elements that make this app really helpful to its users. Newsfeed, for instance, displays the latest updates about orders. The toggle section shows an example of how a distributor can customize his or her order in the fastest way, as a lot of components of an order are usually predefined, and you just need to make a selection. The chart widget is there to show the number of orders over time and the revenue, which is really important for the distributors.
Let us know what you think about this all, guys!
Press “L” to show some love!
Don’t forget to follow Zajno on social media and feel free to drop us a line:
Facebook | UpLabs | Twitter | Instagram | Zajno